Sep 16, 2010

16 Sep 2010 - Noble seems to have peaked; NOL looks erm...

Noble Group
A very obvious dark cloud cover although its a shame that the volume is low. However with most indicators at oversold region and have begun to crossover. It only makes sense to short.

NOL
YZJ & Cosco rallying up like nobody's business. So everyone is thinking NOL is the laggard? Not really, all 3 rallied up around 31st Aug. Its just that NOL's % increment is lesser than the other 2.
Currently, NOL is trending up within the channel and that its attempting to flirt with the channel's support. IMO, with the indicators favouring a downturn, dont bank too much on this counter.
Everyone's looking at a $2.10 profit margin. Perhaps it pays to be a contrarian.

Sep 6, 2010

Something's brewing for Raffles Edu; DBS looks like its going to break out

I dont trade pennies, but this might be an exception.


I always love the Ichimoku Indicators and it's telling me potentially DBS has more upside. In fact there's a hidden gap which I'm darn sure its going to close up.


As always caveat emptor

Sep 2, 2010

What I have been trading so far

I really have to apologize that I did not post as promised, so I hope this post makes it up abit albeit too late.
Technical analysis led me to believe that Olam was a great buy and I bought it right before it shot up. However I did not have the foresight to sell it when it was $2.75.

Two days ago, I saw a breakout indicator in golden agri, and I had to queue just before it opened, and true enough, upon opening, it shot up with incredible volume. That indicator was the classic kumo cloud breakout sign.

Of course, talk is so cheap, so I decided to post my trades here to garner some credibility heh heh.
I trade with Lim&Tan so those who use it, will find this user interface familiar. My last trade was today, selling off GAR for $500 profit excluding commisson. If you noticed, I also attempted to buy NOL but with no success and I cancelled my trade at 1230pm today.

The following analysis is not an inducement to buy or sell but it is something that I am looking to take action on. period. It is at your own risk.


Everyone's favourite counter- Genting. Since its excellent financial report, it has rocketed beyond one's wildest dreams. To me however, it will always remain as a kelong counter. Its fine that I missed the boat but when u see a somewhat dark cloud cover, coupled with indicators screaming overbought - you know what to do.

It is however prudent to wait for confirmation of the downtrend because Genting is heavily played by the big boys out there.

Aug 25, 2010

Stocks analysis resumes next week!

Terribly busy over the past month; bogged down with work and not to mention laziness.

Jul 11, 2010

Big movement on the cards for Singtel?

In my opinion, this one's very straightforward. It could potentially either break-out or break down thanks to a symmetrical triangle pattern formed here. And I'm favouring a break out. Here's why:
  1. Technical indicators show there's still room for up size if it happens. Bollinger bands are tightening which complements the current chart pattern.
  2. STI has formed a mini inverse H&S. Singtel being a major component would stand to gain if a breakout is confirmed.
  3. Q3 optimism on earnings is growing on the whole. Fundamentally, Singtel has done well for the last financial year; it should follow through for 2010 Q3.
  4. Singtel is expected to pay out its $80 dividend per lot in August. Price could also potentially be pushed up in advanced.

Jul 8, 2010

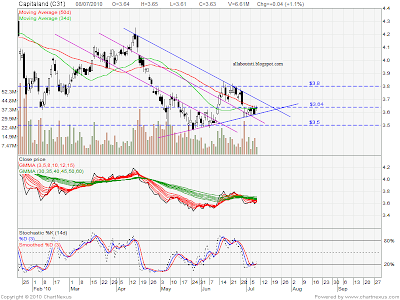
8th July 2010 - CapitaLand Technical Analysis

Price fluctuations will most probably be kept within the boundaries of a somewhat symmetrical triangle. Volume has begun to decrease slightly; the calm before the storm? The indicators show that a breakout is favoured more as opposed to a breakdown.

Jul 7, 2010

Another contrarian look at STI

The market sentiment is moderately bearish, however a surprise looms over the horizon - a potential reverse H&S.